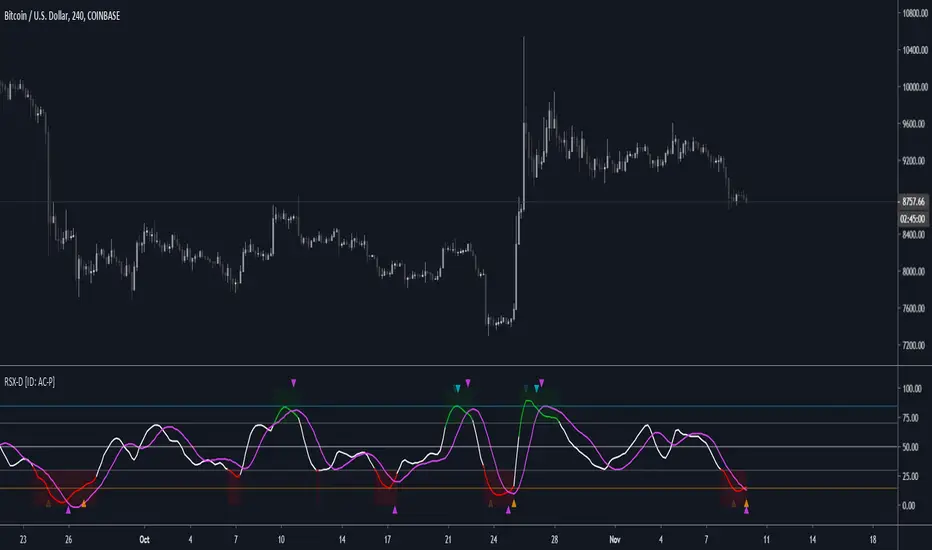
RSX-D [ID: AC-P]The "AC-P" version of Jaggedsoft's RSX Divergence and Everget's RSX script is my personal customized version of RSX with the following additions and modifications:
LSMA-D line that averages in three LSMA components to form a composite, the LSMA-D line. Offset for the LSMA-D line is set to -2 to offset latency from averaging togther the LSMA components to form a composite - recommended to adjust to your timeframe and asset/pair accordingly.
Divergence component from JustUncle, RicardoSantos, and Neobutane divergence scripts
Crossover indication and alerts for Midline, and custom M1 and M2 levels for both RSX and the LSMA-D line from Daveatt's CCI Stochastic Script
EMA21/55 zone cross highlighting option
SMA9/EMA45 MA option from my RSI sma/ema Cu script
Libertus Divergences and Pivot labels from Jaggedsoft's RSX Divergence script are hidden/off by default
Designed for darkmode by default. Minor visual changes from Jaggedsoft's and Everget's script(s) for darkmode and visual aesthetic.
Please Note:
Divergences that use fractal-based detection logic, offset, or a combination of both generally have a 1-2 bar/candle lag. This is an INHERENT limitation of divergence detection with fractals and offsets. Divergences generally will have a higher strikerate on HTF than LTF due to the 1-2 bar lag. While I'm not going to rule out a programming solution or math construct/formula that attempts to alleivates the 1-2 bar lag for divergences, this script is not it - please keep that in mind when using divergence components with a fractal base and offset.
LSMA-D is a composite of three LSMA lines, all with offset options. Different lengths and Offset values can compensate/adjust for the smoothing/latency from RSX, but only up to a certain point. For each LSMA, the least square regression line is calculated for the previous time periods, so the idea is that with finely tuned adjustments, you can get crossover/crossunder signals from the RSX with the LSMA-D line that you simply can't get with the SMA9/EMA45 due to the already smoothed RSX.
The defaults for the RSX and various components for the LSMA-D here will MOSTLY LIKELY NOT WORK OR BE APPLICABLE to every timeframe and asset that you trade - adjust, backtest, and test accordingly. The defaults are here are MEANT to be adjusted to the asset class and timeframe that you are trading.
If you're not familiar with the LSMA, tradingview author Alexgrover has a few great scripts that go into detail how the LSMA works, in addition to different interpretations and implementations of the LSMA.
References/Acknowledgements:
//@version=4
// Copyright (c) 2019-present, Alex Orekhov (everget)
// Jurik RSX script may be freely distributed under the MIT license.
//
//-------------------------------------------------------------------
// Acknowledgements:
//---- Base script:
// RSX Divergence — SharkCIA by Jaggedsoft
//
// Jurik Moving Average by Everget
//
//---- Divergences/Signals:
// Libertus RSI Divergences
//
// Price Divergence Dectector V3 by JustUncle
//
// Price Divergence Detector V2 by RicardoSantos
//
// Stochastic RSI with Divergences by Neobutane
//
// CCI Stochastic by Daveatt
//
//---- Misc. Reference:
// RSI SMA/EMA Cu by Auroagwei
//
// CBCI Cu by Auroagwei
//
// Chop and explode by fhenry0331
//
// T-Step LSMA by RafaelZioni
//
// Scripts by Jaggedsoft for structure and formatting
// Scripts by Everget for structure and formatting
//-------------------------------------------------------------------
// RSX-D v08
// Author: Auroagwei
// www.tradingview.com
//-------------------------------------------------------------------
Pesquisar nos scripts por "rsi divergence"
Entropy Divergence (No Repaint) [PhenLabs]📊 Entropy Divergence (No Repaint)
Version: PineScript™ v6
📌 Description
The Entropy Divergence Scalper (EDS) is a sophisticated trading indicator that applies information theory to market analysis. By calculating Shannon Entropy on price returns, it identifies periods when market behavior becomes more predictable and orderly—the ideal conditions for divergence-based trading.
Traditional divergence indicators generate signals regardless of market conditions, leading to many false signals during chaotic, high-entropy periods. EDS solves this by acting as an intelligent filter: it only triggers signals when entropy drops below your specified threshold, indicating that the market has entered a more structured, tradeable state.
This indicator is built with a strict non-repainting guarantee. All signals use barstate.isconfirmed and only appear after bar close, giving you reliable signals you can trust for live trading.
🚀 Points of Innovation
Shannon Entropy integration measures market randomness using information theory mathematics
Dual divergence engine detects both RSI and Volume divergences simultaneously
Entropy-filtered signals eliminate noise by only triggering in low-entropy (predictable) market conditions
100% non-repainting architecture ensures all signals are confirmed and historically accurate
Multi-layer confirmation combines entropy state, RSI divergence, and volume divergence for higher probability setups
Dynamic color visualization provides instant visual feedback on current market entropy state
🔧 Core Components
Shannon Entropy Calculator: Bins price returns into histograms and calculates entropy using H(X) = -Σ p(x) × log₂(p(x))
RSI Divergence Detector: Identifies when price makes lower lows while RSI makes higher lows (bullish) or price makes higher highs while RSI makes lower highs (bearish)
Volume Divergence Detector: Spots increasing volume interest at price lows (bullish) or decreasing conviction at price highs (bearish)
Pivot Detection System: Uses configurable lookback periods to identify and track price, RSI, and volume pivots
Signal Classification Engine: Labels signals as RSI, VOL, or RSI+VOL based on which divergences triggered
🔥 Key Features
Entropy Threshold Control: Set your preferred entropy level (default 2.5) to filter out signals during chaotic market periods
Configurable Smoothing: EMA smoothing on entropy values reduces noise while maintaining signal responsiveness
Flexible Pivot Detection: Adjust left/right lookback bars to tune sensitivity for different trading styles
Divergence Search Range: Control how far back the indicator looks for divergence patterns (20-200 bars)
Minimum Pivot Distance: Prevents false signals from pivots that are too close together
Complete Alert System: Four alert conditions for bullish signals, bearish signals, any signal, and low entropy zone entry
🎨 Visualization
Dynamic Entropy Line: Color gradient shifts from green (low entropy/tradeable) to orange (high entropy/chaotic)
Entropy Threshold Line: Dashed reference line shows your configured entropy threshold
Low Entropy Zone Fill: Background highlighting indicates when market is in tradeable low-entropy state
Scaled RSI Plot: RSI overlay scaled to fit the entropy pane for easy correlation analysis
Normalized Volume Bars: Volume displayed as columns normalized against 20-period average
Signal Labels: Clear LONG/SHORT labels with divergence type (RSI, VOL, or RSI+VOL)
Information Table: Real-time display of entropy value, state, RSI, and current signal status
📖 Usage Guidelines
Entropy Lookback Period — Default: 20, Range: 5-100 — Controls how many bars are used for entropy calculation; higher values provide smoother readings but slower response
Histogram Bins — Default: 10, Range: 5-50 — Number of bins for probability distribution; more bins provide finer granularity
Low Entropy Threshold — Default: 2.5, Range: 0.5-4.0 — Signals only trigger when entropy drops below this value; lower settings are more selective
Entropy Smoothing — Default: 3, Range: 1-10 — EMA smoothing applied to raw entropy values for noise reduction
RSI Length — Default: 14, Range: 5-50 — Standard RSI calculation period
Pivot Lookback Left — Default: 5, Range: 2-20 — Bars to the left for pivot detection
Pivot Lookback Right — Default: 2, Range: 1-10 — Bars to the right for pivot confirmation; lower values produce faster signals
Divergence Search Range — Default: 60, Range: 20-200 — Maximum bars to look back for divergence comparison
Min Bars Between Pivots — Default: 5, Range: 3-30 — Minimum distance between pivots for valid divergence detection
✅ Best Use Cases
Scalping during low-volatility consolidation periods when entropy drops and price becomes more predictable
Swing trade entry timing by waiting for divergence signals in low-entropy market conditions
Trend reversal identification when both RSI and Volume divergences align with low entropy readings
Multi-timeframe confirmation by checking entropy state on higher timeframes before taking signals
Filtering existing strategies by adding entropy as a confirmation layer to reduce false signals
⚠️ Limitations
Signals appear with a delay due to pivot confirmation requirements (pivotLookbackRight bars after pivot forms)
May generate fewer signals during strongly trending markets where entropy remains elevated
Entropy threshold requires optimization for different instruments and timeframes
Not designed for high-frequency trading due to bar-close confirmation requirement
Divergences can fail in extremely strong trends where momentum overwhelms the signal
💡 What Makes This Unique
First indicator to combine Shannon Entropy filtering with multi-factor divergence detection
Information theory approach provides mathematical foundation for identifying tradeable market states
Triple confirmation requirement (low entropy + divergence + bar close) significantly reduces false signals
Non-repainting guarantee makes it suitable for strategy backtesting and live trading
Open-source PineScript v6 code allows traders to understand and customize the methodology
🔬 How It Works
Step 1 — Entropy Calculation: The indicator calculates logarithmic returns, bins them into a histogram, and computes Shannon Entropy to measure market randomness
Step 2 — Entropy Filtering: When smoothed entropy drops below the threshold, the market is considered to be in a tradeable low-entropy state
Step 3 — Pivot Detection: The system continuously tracks price, RSI, and volume pivots using configurable lookback parameters
Step 4 — Divergence Analysis: When a new pivot is confirmed, the indicator compares it against previous pivots to detect bullish or bearish divergences
Step 5 — Signal Generation: A final signal only triggers when low entropy conditions coincide with a confirmed divergence pattern on a closed bar
💡 Note:
This indicator is designed for educational purposes and technical analysis. Always use proper risk management and never risk more than you can afford to lose. The non-repainting guarantee means signals will only appear after bar close—watch the indicator in real-time to verify this behavior. For optimal results, consider combining EDS signals with support/resistance levels and overall market context.
Dual RSI Spread Strategy [Custom]
概述
这是一个综合性的动量交易工具,结合了双重 RSI 交叉系统与经典 RSI 背离检测功能。该指标旨在通过分析短期与长期动量的“剪刀差”来识别潜在的超买/超卖区域,并辅以顶底背离信号作为反转确认。
核心功能与逻辑
1. 双重 RSI 差值信号 (Dual RSI Spread) 该策略同时计算两条 RSI 曲线:
短周期 RSI (默认 13):对价格变化反应灵敏。
长周期 RSI (默认 42):代表长期趋势基准。
交易信号基于两条 RSI 的差值 (Spread) 生成,逻辑如下:
🟢 买入信号 (Buy):当 长周期 RSI - 短周期 RSI > 20。这意味着短期动量严重低于长期基准,市场可能处于深度超卖状态,存在均值回归需求。
🔴 卖出信号 (Sell):当 短周期 RSI - 长周期 RSI > 20。这意味着短期动量冲高过快,远超长期基准,市场可能过热。
2. RSI 顶底背离 (Divergence) 指标内置了经典的背离检测算法(可选择开启/关闭),应用于短周期 RSI:
Bullish Divergence (看涨背离):价格创新低,但 RSI 底部抬高。
Bearish Divergence (看跌背离):价格创新高,但 RSI 顶部降低。 (注意:背离功能默认关闭,请在设置中勾选 "Calculate Divergence" 开启)
3. 高度自定义
支持自定义 RSI 长度、平滑类型 (SMA/EMA) 及平滑长度。
支持自定义差值阈值(默认 20)。
完整的告警支持:可分别为差值信号和背离信号设置 TradingView 告警。
如何使用 建议将“差值信号”作为预警,结合“背离信号”作为确认。当出现“买入”标签且随后出现 Bullish 背离时,胜率通常更高。
Overview
This is a comprehensive momentum trading tool that combines a Dual RSI Cross System with Classic RSI Divergence Detection. It is designed to identify potential overbought/oversold conditions by analyzing the "spread" between short-term and long-term momentum, reinforced by divergence signals for reversal confirmation.
Key Features & Logic
1. Dual RSI Spread Signals The script calculates two RSI lines simultaneously:
Short RSI (Default 13): Sensitive to immediate price changes.
Long RSI (Default 42): Represents the longer-term baseline.
Trading signals are generated based on the Spread (Difference) between these two lines:
🟢 BUY Signal: Triggers when Long RSI - Short RSI > 20. This implies short-term momentum is significantly below the long-term baseline, suggesting a deep oversold condition and potential mean reversion.
🔴 SELL Signal: Triggers when Short RSI - Long RSI > 20. This implies short-term momentum has spiked too far above the baseline, suggesting an overheated market.
2. RSI Divergence The indicator includes a built-in divergence detection algorithm (optional) applied to the Short RSI:
Bullish Divergence: Price makes a lower low, but RSI makes a higher low.
Bearish Divergence: Price makes a higher high, but RSI makes a lower high. (Note: Divergence is disabled by default. Please check "Calculate Divergence" in the settings to enable).
3. Fully Customizable
Configurable RSI lengths, Smoothing types (SMA/EMA), and Smoothing lengths.
Adjustable Spread Threshold (Default is 20).
Full Alert Support: Set alerts specifically for Spread Signals or Divergence detections.
How to Use It is recommended to use the "Spread Signals" as an early warning system and the "Divergence Signals" as confirmation. A setup where a "BUY" spread label is followed by a Bullish Divergence line often presents a higher probability trade.
Liquidity Trap Detector Pro [PyraTime]The Problem: Why You Get Stopped Out
90% of retail traders place their stop-losses at obvious swing highs and lows. Institutional algorithms ("Smart Money") are programmed to push price through these levels to trigger liquidity, fill their heavy orders, and then immediately reverse the market.
If you have ever had your stop hit right before the market moves exactly where you predicted—you were the victim of a Liquidity Trap.
The Solution: Visualizing the "Stop Hunt"
Liquidity Trap Detector Pro is not just a support/resistance indicator. It is a comprehensive Reversal Scoring Engine.
Unlike standard indicators that spam signals on every wick, this tool uses a proprietary 5-Star Scoring System to analyze the quality of the trap. It validates every signal using Wick Symmetry, RSI Divergence, and Volume Analysis to separate a true reversal from a trend continuation.
Key Features (USP)
- 5-Star Scoring Engine: Every signal is rated from 1 to 5 stars. Stop guessing if a signal is valid; let the algorithm check the confluence for you.
- Glassmorphism Visuals: Gone are the messy lines. We use modern, semi-transparent "Liquidity Zones" that keep your chart clean and professional.
- Smart Terminology: Automatically identifies Bull Traps (Buyers trapped at highs) and Bear Traps (Sellers trapped at lows).
- Heads-Up Display (HUD): A professional dashboard monitors the market state, active filters, and recent trap statistics in real-time.
- Strict Non-Repainting: (Technical Note) This script uses strict non-repainting logic. All Higher Timeframe (HTF) data is confirmed and closed before a signal is generated, ensuring historical accuracy.
---
Tutorial: How to Trade This Indicator
1. Understanding the Signals
We use correct institutional terminology to describe the market mechanics:
GREEN Signal (BEAR TRAP):
- What happened: Price swept a Swing Low, enticing sellers (Bears) to enter. The candle then reversed and closed back inside the range, trapping those sellers.
- The Trade: This is a Bullish Reversal setup (Long).
RED Signal (BULL TRAP):
- What happened: Price swept a Swing High, enticing buyers (Bulls) to breakout. The candle reversed and closed lower, trapping the buyers.
- The Trade: This is a Bearish Reversal setup (Short).
2. The 5-Star Scoring System
Not all traps are created equal. The stars tell you how much "Confluence" exists:
- 1 Star: A basic structure sweep. Risky.
- 3 Stars: A solid setup backed by either Volume or Divergence.
- 5 Stars: The "Perfect" Trap. Structure Sweep + RSI Divergence + Volume Spike + Wick Symmetry. High Probability.
3. The Strategy
- Wait for the Zone: Watch price approach a coloured Liquidity Zone.
- Observe the Reaction: Do not trade blindly. Wait for the candle to close.
- Check the Stars: Look for at least 3 Stars before considering an entry.
- Confirm with HUD: Glance at the Dashboard to ensure the "RSI Filter" and "Vol Filter" agree with your analysis.
---
Settings Guide
Structure Settings:
- Pivot Lookback: Adjusts how sensitive the zones are (Default: 10/5).
- HTF Confirmation: Optional filter to only show traps that align with Higher Timeframe structure (e.g., 1H or 4H).
Quality Filters:
- RSI Divergence: Requires momentum to disagree with price (classic reversal sign).
- Volume Spike: Requires volume to be higher than average (Smart Money footprint).
Visuals:
- Clean Mode: A presenter-favorite feature. Hides all historical zones and leaves only the active setup—perfect for taking screenshots or sharing analysis.
Disclaimer
This tool is designed to assist with technical analysis and identifying potential areas of interest. It does not guarantee profits. Trading involves significant risk; always use proper risk management.
Linh's Anomaly Radar v2What this script does
It’s an event detector for price/volume anomalies that often precede or confirm moves.
It watches a bunch of patterns (Wyckoff tests, squeezes, failed breakouts, turnover bursts, etc.), applies robust z-scores, optional trend filters, cooldowns (to avoid spam), and then fires:
A shape/label on the bar,
A row in the mini panel (top-right),
A ready-made alertcondition you can hook into.
How to add & set up (TradingView)
Paste the script → Save → Add to chart on Daily first (works on any TF).
Open Settings → Inputs:
General
• Use Robust Z (MAD): more outlier-resistant; keep on.
• Z Lookback: 60 bars is ~3 months; bump to 120 for slower regimes.
• Cooldown: min bars to wait before the same signal can fire again (default 5).
• Use trend filter: if on, “bullish” signals only fire above SMA(tfLen), “bearish” below.
Thresholds: fine-tune sensitivity (defaults are sane).
To create alerts: Right-click chart → Add alert
Condition: Linh’s Anomaly Radar v2 → choose a specific signal or Composite (Σ).
Options: “Once per bar close” (recommended).
Customize message if you want ticker/timeframe in your phone push.
The mini panel (top-right)
Signal column: short code (see cheat sheet below).
Fired column: a dot “•” means that on the latest bar this signal fired.
Score (right column): total count of signals that fired this bar.
Σ≥N shows your composite threshold (how many must fire to trigger the “Composite” alert).
Shapes & codes (what’s what)
Code Name (category) What it’s looking for Why it matters
STL Stealth Volume z(volume)>5 & ** z(return)
EVR Effort vs Result squeeze z(vol)>3 & z(TR)<−0.5 Heavy effort, tiny spread → absorption
TGV Tight+Heavy (HL/ATR)<0.6 & z(vol)>3 Tight bar + heavy tape → pro activity
CLS Accumulation cluster ≥3 of last 5 bars: up, vol↑, close near high Classic accumulation footprint
GAP Open drive failure Big gap not filled (≥80%) & vol↑ One-sided open stalls → fade risk
BB↑ BB squeeze breakout Squeeze (z(BBWidth)<−1.3) → close > upperBB & vol↑ Regime shift with confirmation
ER↑ Effort→Result inversion Down day on vol then next bar > prior high Demand overwhelms supply
OBV OBV divergence OBV slope up & ** z(ret20)
WER Wide Effort, Opposite Result z(vol)>3, close+1 Selling into strength / distribution
NS No-Supply (Wyckoff) Down bar, HL<0.6·ATR, vol << avg Sellers absent into weakness
ND No-Demand (Wyckoff) Up bar, HL<0.6·ATR, vol << avg Buyers absent into strength
VAC Liquidity Vacuum z(vol)<−1.5 & ** z(ret)
UTD UTAD (failed breakout) Breaks swing-high, closes back below, vol↑ Stop-run, reversal risk
SPR Spring (failed breakdown) Breaks swing-low, closes back above, vol↑ Bear trap, reversal risk
PIV Pocket Pivot Up bar; vol > max down-vol in lookback Quiet base → sudden demand
NR7 Narrow Range 7 + Vol HL is 7-bar low & z(vol)>2 Coiled spring with participation
52W 52-wk breakout quality New 52-wk close high + squeeze + vol↑ High-quality breakouts
VvK Vol-of-Vol kink z(ATR20,200)>0.5 & z(ATR5,60)<0 Long-vol wakes up, short-vol compresses
TAC Turnover acceleration SMA3 vol / SMA20 vol > 1.8 & muted return Participation surging before move
RBd RSI Bullish div Price LL, RSI HL, vol z>1 Exhaustion of sellers
RS↑ RSI Bearish div Price HH, RSI LH, vol z>1 Exhaustion of buyers
Σ Composite Count of all fired signals ≥ threshold High-conviction bar
Placement:
Triangles up (below bar) → bullish-leaning events.
Triangles down (above bar) → bearish-leaning events.
Circles → neutral context (VAC, VvK, Composite).
Key inputs (quick reference)
General
Use Robust Z (MAD): keep on for noisy tickers.
Z Lookback (lenZ): 60 default; 120 if you want fewer alerts.
Trend filter: when on, bullish signals require close > SMA(tfLen), bearish require <.
Cooldown: prevents repeated firing of the same signal within N bars.
Phase-1 thresholds (core)
Stealth: vol z > 5, |ret z| < 1.
EVR: vol z > 3, TR z < −0.5.
Tight+Heavy: (HL/ATR) < 0.6, vol z > 3.
Cluster: window=5, min=3 strong bars.
GapFail: gap/ATR ≥1.5, fill <80%, vol z > 2.
BB Squeeze: z(BBWidth)<−1.3 then breakout with vol z > 2.
Eff→Res Up: prev bar heavy down → current bar > prior high.
OBV Div: OBV uptrend + |z(ret20)|<0.3.
Phase-2 thresholds (extras)
WER: vol z > 3, close1.
No-Supply/No-Demand: tight bar & very light volume vs SMA20.
Vacuum: vol z < −1.5, |ret z|>1.5.
UTAD/Spring: swing lookback N (default 20), vol z > 2.
Pocket Pivot: lookback for prior down-vol max (default 10).
NR7: 7-bar narrowest range + vol z > 2.
52W Quality: new 52-wk high + squeeze + vol z > 2.
VoV Kink: z(ATR20,200)>0.5 AND z(ATR5,60)<0.
Turnover Accel: SMA3/SMA20 > 1.8 and |ret z|<1.
RSI Divergences: compare to n bars back (default 14).
How to use it (playbooks)
A) Daily scan workflow
Run on Daily for your VN watchlist.
Turn Composite (Σ) alert on with Σ≥2 or ≥3 to reduce noise.
When a bar fires Σ (or a fav combo like STL + BB↑), drop to 60-min to time entries.
B) Breakout quality check
Look for 52W together with BB↑, TAC, and OBV.
If WER/ND appear near highs → downgrade the breakout.
C) Spring/UTAD reversals
If SPR fires near major support and RBd confirms → long bias with stop below spring low.
If UTD + WER/RS↑ near resistance → short/fade with stop above UTAD high.
D) Accumulation basing
During bases, you want CLS, OBV, TGV, STL, NR7.
A pocket pivot (PIV) can be your early add; manage risk below base lows.
Tuning tips
Too many signals? Raise stealthVolZ to 5.5–6, evrVolZ to 3.5, use Σ≥3.
Fast movers? Lower bbwZthr to −1.0 (less strict squeeze), keep trend filter on.
Illiquid tickers? Keep MAD z-scores on, increase lookbacks (e.g., lenZ=120).
Limitations & good habits
First lenZ bars on a new symbol are less reliable (incomplete z-window).
Some ideas (VWAP magnet, close auction spikes, ETF/foreign flows, options skew) need intraday/external feeds — not included here.
Pine can’t “screen” across the whole market; set alerts or cycle your watchlist.
Quick troubleshooting
Compilation errors: make sure you’re on Pine v6; don’t nest functions in if blocks; each var int must be declared on its own line.
No shapes firing: check trend filter (maybe price is below SMA and you’re waiting for bullish signals), and verify thresholds aren’t too strict.
MA Divergences for any indicatorThis is a mod of Tistas mod of the default RSI divergences.
www.tradingview.com
This is a SMA that can be applied to any indicator for divergence seeking. This can be useful if you use a custom indicator script and want divergences added, or for any oscillator really. Set the length to 1 and it will mirror the oscillator in question.
(JS) Ultimate RSISo my goal here was to combine all of my RSI ideas into a single indicator in order to make kind of a "Swiss Army Knife" version of the Relative Strength Index ...
------------------------------------------------------------------------------------------------------------------------------------------------------------------------------------------------------------------------------------------------------------------
So, let's begin with the first RSI indicator I made, which is the RSIDVW (Divergence/Volume Weighted);
To rephrase my original post, the "divergence/volume weighted" portion is meant to expand upon the current RSI format by adding more variables into the equation.
The standard RSI is based off one value that you select (open, close, OHLC4, HLC3, etc.) while this version takes three variables into account.
The default setting is to have RSI normal without anything added to it (Divergence Weight = 0)
1st - it takes the standard variable that RSI normally uses.
2nd - it factors RSI divergence by taking the RSI change % and price change % to form a ratio. Using this ratio, I duplicated the RSI formula and created a divergence RS to be factored in with the standard price RS .
3rd - it takes Relative Volume and amplifies/weakens the move based upon volume confirmation. (So if Relative Volume for a price bar is 1.0, the RSI plot would be the same as it normally would)
So to explain the parameters
- Relative Volume Length: This uses the RV length you specify to determine spikes in volume (or lack of volume ), which then is added into the formula to influence the strength of the RSI move
- RV x Divergence: This is how I calculated the original formula, but you can leave this unchecked to turn Relative Volume off, or apply elsewhere.
- RV x RS: There's two sides, Divergence RS and Standard RS - these check marks allow you to select which part you prefer to be multiplied by Relative Volume .
Checking neither turns off Relative Volume , while checking both amplifies its effects by placing it on both sides of the equation.
-Divergence Weight: This controls how much the DVW portion of the formula influences the RSI plot. As I referred to earlier, default is 0 making RSI normal. The Scale is 0-2, so 1.0 would be the same as 50%.
When I do have DVW on, I generally set it to 0.5
-SMA Divergence: To smooth, or not to smooth, that is the question. UJsing an SMA here is much smoother in my opinon, but leaving it unchecked runs it through an RMA the same way standard RSI is calculated.
-Show Fractal Channel: This allows you to see the whole fractal channel around the RSI (This portion of the code, compliments of the original Ricardo Santos fractal script)
------------------------------------------------------------------------------------------------------------------------------------------------------------------------------------------------------------------------------------------------------------------
The next portion of the script is adding a "Slow RSI"...
This is rather simple really, it allows you to add a second RSI plot so that you can watch for crossovers between fast and slow lines.
-Slow RSI: This turns on the second RSI Plot.
-Slow RSI Length: This determines the length of the second RSI Plot.
------------------------------------------------------------------------------------------------------------------------------------------------------------------------------------------------------------------------------------------------------------------
Pivot Point RSI was something a friend of mine requested I make which turned out pretty cool, I thought... It is also available in this indicator.
-Pivot Points: Selecting this enables the rest of the pivot point related parts of the script
If Pivot Points isn't selected, none of the following things will work
-Plot Pivot: Plots the pivot point .
-Plot S1/R1: Plots S1/R1.
-Plot S2/R2: Plots S2/R2.
-Plot S3/R3: Plots S3/R3.
-Plot S4/R4: Plots S4/R4.
-Plot S5/R5: Plots S5/R5.
-Plot Halfway Points: Plots a line between each pivot .
-Show Pivot Labels: Shows the proper label for each pivot .
When using intraday charts, from a 15 minute interval or less the pivots are calculated based on a single days worth of price action, above that the distance expands.
Here are the current resolutions Pivot Points will work with:
Minutes - 1 , 2, 3, 5, 10, 13, 15, 20, 30, 39, 78, 130, 195
Hours - 1, 2, 3, 4, 5, 6
Daily
Weekly
Currently not available on seconds or monthly
------------------------------------------------------------------------------------------------------------------------------------------------------------------------------------------------------------------------------------------------------------------
Background Colors
Background Colors: I have six color schemes I created for this which can be toggled here (they can be edited).
Gray Background for Dark Mode: Having this on looks much better when using dark mode on your charts.
------------------------------------------------------------------------------------------------------------------------------------------------------------------------------------------------------------------------------------------------------------------
Now finally the last portion, Fibonacci Levels
-Fibonacci Levels: This is off, by default, which then uses the standard levels on RSI (30-50-70). When turned on, it removes these and marks fib levels from 0.146 through 0.886.
------------------------------------------------------------------------------------------------------------------------------------------------------------------------------------------------------------------------------------------------------------------
So the quick rundown:
Ultimate RSI contains "divergence/volume weighted" modifications, a slow RSI plot, pivot points , and Fibonacci levels all while auto-plotting divergence and having the trend illustrated in the background colors.
RSI has always been my "go to" indicator, so I hope you all enjoy this as much as I do!
RSI Fibonacci Flow [JOAT]RSI Fibonacci Flow - Advanced Fibonacci Retracement with RSI Confluence
Introduction
RSI Fibonacci Flow is an open-source overlay indicator that combines automatic Fibonacci retracement levels with RSI momentum analysis to identify high-probability trading zones. The indicator automatically detects swing highs and lows, draws Fibonacci levels, and generates confluence signals when RSI conditions align with key Fibonacci zones.
This indicator is designed for traders who use Fibonacci retracements but want additional confirmation from momentum analysis before entering trades.
Originality and Purpose
This indicator is NOT a simple mashup of RSI and Fibonacci tools. It is an original implementation that creates a synergistic relationship between two complementary analysis methods:
Why Combine RSI with Fibonacci? Fibonacci retracements identify WHERE price might reverse, but they don't tell you WHEN. RSI provides the timing component by showing momentum exhaustion. When price reaches the Golden Zone (50%-61.8%) AND RSI shows oversold conditions, the probability of a successful bounce increases significantly.
Original Confluence Scoring System: The indicator calculates a 0-5 confluence score that weights multiple factors: Golden Zone presence (+2), entry zone presence (+1), RSI extreme alignment (+1), RSI divergence (+1), and strong RSI momentum (+1). This scoring system is original to this indicator.
Automatic Pivot Detection: Unlike manual Fibonacci tools, this indicator automatically detects swing highs and lows using a configurable pivot algorithm, then draws Fibonacci levels accordingly. The pivot detection uses a center-bar comparison method that checks if a bar's high/low is the highest/lowest within the specified depth on both sides.
Dynamic Trend Awareness: The indicator determines trend direction based on pivot sequence (last pivot was high or low) and adjusts Fibonacci orientation accordingly. In uptrends, 0% is at swing low; in downtrends, 0% is at swing high.
Each component serves a specific purpose:
Fibonacci levels identify potential reversal zones based on natural price ratios
RSI provides momentum context to filter out low-probability setups
Confluence scoring quantifies setup quality for position sizing decisions
Automatic pivot detection removes subjectivity from level placement
Core Concept: RSI-Fibonacci Confluence
The most powerful trading setups occur when multiple factors align. RSI Fibonacci Flow identifies these moments by:
Automatically detecting price pivots and drawing Fibonacci levels
Tracking which Fibonacci zone the current price occupies
Monitoring RSI for overbought/oversold conditions
Generating signals when RSI extremes coincide with key Fibonacci levels
Scoring confluence strength on a 0-5 scale
When price reaches the Golden Zone (50%-61.8%) while RSI shows oversold conditions in an uptrend, the probability of a bounce increases significantly.
Fibonacci Levels Explained
The indicator draws nine Fibonacci levels based on the most recent swing:
0% (Swing Low/High): The starting point of the move
23.6%: Shallow retracement - often seen in strong trends
38.2%: First significant support/resistance level
50%: Psychological midpoint of the move
61.8% (Golden Ratio): The most important Fibonacci level
78.6%: Deep retracement - last defense before trend failure
100% (Swing High/Low): The end point of the move
127.2% (TP1): First extension target for take profit
161.8% (TP2): Second extension target for take profit
The Golden Zone
The area between 50% and 61.8% is highlighted as the "Golden Zone" because:
It represents the optimal retracement depth for trend continuation
Institutional traders often place orders in this zone
It offers favorable risk-to-reward ratios
Price frequently bounces from this area in healthy trends
When price enters the Golden Zone, the indicator highlights it with a semi-transparent box and optional background coloring.
Pivot Detection System
The indicator uses a configurable pivot detection algorithm:
pivotDetect(float src, int len, bool isHigh) =>
int halfLen = len / 2
float centerVal = nz(src , src)
bool isPivot = true
for i = 0 to len - 1
if isHigh
if nz(src , src) > centerVal
isPivot := false
break
else
if nz(src , src) < centerVal
isPivot := false
break
isPivot ? centerVal : float(na)
This identifies swing highs and lows by checking if a bar's high/low is the highest/lowest within the specified depth on both sides.
Visual Components
1. Fibonacci Lines
Horizontal lines at each Fibonacci level:
Solid lines for major levels (0%, 50%, 61.8%, 100%)
Dashed lines for secondary levels (23.6%, 38.2%, 78.6%)
Dotted lines for extension levels (127.2%, 161.8%)
Color-coded for easy identification
Configurable line width
2. Fibonacci Labels
Price labels at each level showing:
Fibonacci percentage
Actual price at that level
Golden Zone label highlighted
TP1 and TP2 labels for targets
3. Golden Zone Box
A semi-transparent box highlighting the 50%-61.8% zone:
Gold colored border and fill
Extends from swing start to current bar (or beyond if extended)
Provides clear visual of the optimal entry zone
4. ZigZag Lines
Connecting lines between detected pivots:
Cyan for moves from low to high
Orange for moves from high to low
Helps visualize market structure
Configurable line width
5. Pivot Markers
Small labels at detected swing points:
"HH" (Higher High) at swing highs
"LL" (Lower Low) at swing lows
Helps track market structure
6. Entry Signals
BUY and SELL labels when confluence conditions are met:
BUY: RSI oversold + price in entry zone + uptrend + positive momentum
SELL: RSI overbought + price in entry zone + downtrend + negative momentum
Labels include "RSI+FIB" to indicate confluence
Confluence Scoring System
The indicator calculates a confluence score from 0 to 5:
+2 points: Price is in the Golden Zone (50%-61.8%)
+1 point: Price is in the entry zone (38.2%-61.8%)
+1 point: RSI is oversold in uptrend OR overbought in downtrend
+1 point: RSI divergence detected (bullish or bearish)
+1 point: Strong RSI momentum (change > 2 points)
Confluence ratings:
STRONG (4-5): Multiple factors align - high probability setup
MODERATE (2-3): Some factors align - proceed with caution
WEAK (0-1): Few factors align - wait for better setup
Dashboard Panel
The 10-row dashboard provides comprehensive analysis:
RSI Value: Current RSI reading (large text)
RSI State: OVERBOUGHT, OVERSOLD, BULLISH, BEARISH, or NEUTRAL
Fib Trend: UPTREND or DOWNTREND based on last pivot sequence
Price Zone: Current Fibonacci zone (e.g., "GOLDEN ZONE", "38.2% - 50%")
Price: Current close price (large text)
Confluence: Score rating with numeric value (e.g., "STRONG (4/5)")
Nearest Fib: Closest key Fibonacci level with price
TP1 (127.2%): First take profit target price
TP2 (161.8%): Second take profit target price
Input Parameters
Pivot Detection:
Pivot Depth: Bars to look back for swing detection (default: 10)
Min Deviation %: Minimum price move to confirm pivot (default: 1.0)
RSI Settings:
RSI Length: Period for RSI calculation (default: 14)
Source: Price source (default: close)
Overbought: Upper threshold (default: 70)
Oversold: Lower threshold (default: 30)
Fibonacci Display:
Show Fib Lines: Toggle Fibonacci lines (default: enabled)
Show Fib Labels: Toggle price labels (default: enabled)
Show Golden Zone Box: Toggle zone highlight (default: enabled)
Line Width: Thickness of Fibonacci lines (default: 2)
Extend Fib Lines: Extend lines into future (default: enabled)
ZigZag:
Show ZigZag: Toggle connecting lines (default: enabled)
ZigZag Width: Line thickness (default: 2)
Signals:
Show Entry Signals: Toggle BUY/SELL labels (default: enabled)
Show TP Levels: Toggle take profit in dashboard (default: enabled)
Show RSI-Fib Confluence: Toggle confluence analysis (default: enabled)
Dashboard:
Show Dashboard: Toggle information panel (default: enabled)
Position: Choose corner placement
Colors:
Bullish: Color for bullish elements (default: cyan)
Bearish: Color for bearish elements (default: orange)
Neutral: Color for neutral elements (default: gray)
Golden Zone: Color for Golden Zone highlight (default: gold)
How to Use RSI Fibonacci Flow
Identifying Entry Zones:
Wait for price to retrace to the 38.2%-61.8% zone
Check if RSI is approaching oversold (for longs) or overbought (for shorts)
Look for STRONG confluence rating in the dashboard
Enter when BUY or SELL signal appears
Setting Take Profit Targets:
TP1 at 127.2% extension for conservative target
TP2 at 161.8% extension for aggressive target
Consider scaling out at each level
Using the Price Zone:
"BELOW 23.6%" - Price hasn't retraced much; wait for deeper pullback
"23.6% - 38.2%" - Shallow retracement; strong trend continuation possible
"38.2% - 50%" - Good entry zone for trend trades
"GOLDEN ZONE" - Optimal entry zone; highest probability
"61.8% - 78.6%" - Deep retracement; trend may be weakening
"78.6% - 100%" - Very deep; trend reversal possible
"ABOVE/BELOW 100%" - Trend has likely reversed
Confluence Trading Strategy:
Only take trades with confluence score of 3 or higher
STRONG confluence (4-5) warrants larger position size
MODERATE confluence (2-3) warrants smaller position size
WEAK confluence (0-1) - wait for better setup
Alert Conditions
Ten alert conditions are available:
RSI-Fib BUY Signal: Strong bullish confluence detected
RSI-Fib SELL Signal: Strong bearish confluence detected
Price in Golden Zone: Price enters 50%-61.8% zone
New Pivot High: Swing high detected
New Pivot Low: Swing low detected
RSI Overbought: RSI crosses above overbought threshold
RSI Oversold: RSI crosses below oversold threshold
Bullish Divergence: Potential bullish RSI divergence
Bearish Divergence: Potential bearish RSI divergence
Strong Confluence: Confluence score reaches 4 or higher
Understanding Trend Direction
The indicator determines trend based on pivot sequence:
UPTREND: Last pivot was a low after a high (expecting move up)
DOWNTREND: Last pivot was a high after a low (expecting move down)
Fibonacci levels are drawn accordingly:
In uptrend: 0% at swing low, 100% at swing high
In downtrend: 0% at swing high, 100% at swing low
Bar Coloring
When confluence features are enabled:
Cyan bars on strong bullish signals
Orange bars on strong bearish signals
Gold-tinted bars when price is in Golden Zone
Best Practices
Use on 1H timeframe or higher for more reliable pivots
Adjust Pivot Depth based on timeframe (higher for longer timeframes)
Wait for price to enter Golden Zone before considering entries
Confirm RSI is in favorable territory before trading
Use extension levels (127.2%, 161.8%) for realistic profit targets
Combine with support/resistance and candlestick patterns
Higher confluence scores indicate higher probability setups
Limitations
Pivot detection has inherent lag (must wait for confirmation)
Fibonacci levels are subjective - different swings produce different levels
Works best in trending markets with clear swings
RSI can remain overbought/oversold in strong trends
Not all Golden Zone entries will be successful
The source code is open and available for review and modification.
Disclaimer
This indicator is provided for educational and informational purposes only. It is not financial advice. Trading involves substantial risk of loss. Past performance does not guarantee future results. Fibonacci levels are not guaranteed support/resistance - they are probability zones based on historical price behavior. Always conduct your own analysis and use proper risk management.
- Made with passion by officialjackofalltrades :D
RSI Screener and Divergence [5ema]
Displayed on the RSI chart according to a custom timeframe.
Displays the RSI tracking table of various timeframes.
Identify normal divergence, hidden divergence on RSI chat.
Show buy and sell signals (strong, weak) on the board.
Send notifications when RSI has a buy or sell signal.
-----
I reused some functions, made by (i believe that):
©paaax : The table position function.
@everget : The RSI divergence function.
@QuantNomad : The function calculated value and array to show on table for input symbols.
I have commented in my code. Thanks so much!
-----
How it works:
1. Input :
input.int length of RSI => calculate RSI.
input.int upper/lower => checking RSI overbought/oversold.
input.int right bars / left bars => returns price of the pivot low & high point => checking divergence.
input.int range upper / lower bars => compare the low & high point => checking divergence.
input.timeframe => request.security another time frame.
input.string table position => display screener table.
2. Input bool:
plot RSI on chart.
Plot Regular Bullish divergence .
Regular Bearish divergence.
Hidden Bullish divergence .
Hidden Bearish divergence.
3. Basic calculated:
Make function for RSI , pivot low & high point of RSI and price.
Request.security that function for earch time frame.
Result RSI, Divergence.
4. Condition of signal:
Buy condition:
RSI oversold (1)
Bullish divergence (2).
=> Buy if (1) and (2), review buy (1) or (2).
Sell condition:
RSI overbought (3).
Bearish divergence (4).
=> Sell if (3) and (4), review sell (3) or (4).
5. Table screener:
Time frame.
RSI (green - oversold, red - overbought)
Divergence (⬈⬈ - regular bullish , ⬊⬊ regular bearish , ⬊ - hidden bullish , ⬈ - hidden bearish ).
Signal (🟢 - Buy, 🔴 - sell, green 〇 - review buy, red 〇 - review sell)
----
This indicator is for reference only, you need your own method and strategy.
If you have any questions, please let me know in the comments.
Strength of Divergence Across Multiple IndicatorsOverview:
One-stop shop for all your divergence needs, including:
(1) A single metric for divergence strength across multiple indicators.
(2) Labels that make it easy to spot where the truly strong divergence is by showing the overall divergence strength value along with the number of divergent indicators. Hovering over the label shows a breakdown of each divergent indicator and its individual divergence strength value.
(3) Fully customizable, including inputs for pivot lengths, divergence types, and weights for every component of the divergence strength calculation. This allows you to quickly and easily optimize the output for any chart. Don't worry, the default settings will have you covered if you're not interested in what's going on under the hood.
The Divergence Strength Calculation:
The total divergence strength value is the sum of the divergence strengths of all indicators for which divergence was detected at a given bar. Each indicator's individual divergence strength is comprised of two basic components: (1) |ΔPrice| - the magnitude of the change in price over the divergence period (pivot-to-pivot), and (2) |ΔIndicator| - the magnitude of the change in indicator value over the divergence period.
Because different indicators' scales and volatility can vary greatly, the Δ values are expressed in terms of standard deviation to ensure that the values are meaningful and equitable across all indicators and assets/instruments/currency pairs, etc:
|ΔIndicator| = |indicator_value_1 - indicator_value_2| / 2 * StDev(indicator_series,100)
Calculation Weights:
All components of the calculation are weighted and can be modified on the Inputs page in settings (weights are simply multipliers). For example, if you think hidden divergence should carry less weight than regular divergence, you can assign it a lesser weight. Or if you think RSI divergence is worth more than OBV divergence, you can adjust their weights accordingly. List of weights:
Regular divergence weight - default = 1
Hidden divergence weight - default = 1
ΔPrice weight - default = 0.5 (multiplied by the ΔPrice component)
ΔIndicator weight - default = 1.5 (multiplied by the ΔIndicator component)
RSI weight - default = 1.1
OBV weight - default = 0.8
MACD weight - default = 0.9
STOCH weight - default = 0.9
Development for additional indicators is ongoing, as is research into the optimal weight configuration(s).
Other Inputs:
Pivot lengths - specify the number of bars before and after each pivot high/low to consider it a valid candidate for divergence.
Lookback bars and Lookback pivots - specify the number of bars or the number of pivots to look back across.
Price sources - specify separate price sources for bullish and bearish divergence
Display settings - specify how lines and labels should display, including which divergence strength values should show the largest labels. Include/exclude specific divergence types and indicators.
Please report any bugs, or let me know if you have any enhancement suggestions or requests for additional indicators.
@reees
Bull Bear Divergence IndicatorThe script is written for Constance Brown-like anayis with divergence signals between price and indicator (i.e. stock close / RSI divergence)
Note: Though the example here with NVDA shows good reversal predictions, best results generally are optained with un-normalized indicators and oscilators like CB#s comosite index.
(For Trading view written by LazyBear.) I use two different lines: an indi high line for baerish, and an indi low line for bullish divergences.
The script only shows divergences to pivot pairs next to each other, not between actual pivot and those "a few pivots ago"
For individual work, chose your indicator and replace rsi in line 10 with it, anything else is auto. Sript bottom: optional comparison lines addable.
DANI _ MTF Pullback StrategyMTF Pullback - RSI Panel Summary
Purpose: Companion indicator for the main strategy that displays RSI with divergence detection in a separate pane below the price chart.
Settings
ParameterDefaultDescriptionRSI Length14Lookback period for RSI calculationRSI Oversold Level30Threshold for oversold conditionRSI Overbought Level70Threshold for overbought conditionDivergence Lookback Bars10How many bars to look back for divergence detection
What It Displays
RSI Line — Changes color based on zone:
Purple = neutral (between 30-70)
Green = oversold (below 30)
Red = overbought (above 70)
Horizontal Levels:
Red dashed line at 70 (overbought)
Green dashed line at 30 (oversold)
Gray dotted line at 50 (midpoint)
Zone Fills:
Light red shading above 70
Light green shading below 30
Divergence Markers:
"DIV" label with lime circle = bullish divergence (price makes lower low, RSI makes higher low while oversold)
"DIV" label with fuchsia circle = bearish divergence (price makes higher high, RSI makes lower high while overbought)
Background Flash:
Green flash when bullish divergence detected
Red flash when bearish divergence detected
Divergence Logic
Bullish: Price makes a lower low AND RSI makes a higher low AND RSI is in oversold territory → potential reversal up
Bearish: Price makes a higher high AND RSI makes a lower high AND RSI is in overbought territory → potential reversal downand for the strategy15:36Outlined strategy script components and display mechanics.The user wants a summary of the main strategy script, similar to what I provided for the RSI panel. I should cover the purpose, settings, entry conditions, exit conditions, and what it displays on the chart.MTF Pullback Strategy Summary
Purpose: Multi-timeframe pullback strategy that trades trend continuations. Uses 4H timeframe for trend direction and entry timeframe (typically 15M) for precise entries based on RSI divergence and engulfing patterns.
Settings
ParameterDefaultDescriptionTimeframesHigher Timeframe240 (4H)Timeframe for trend detectionTrend FilterEMA Length50EMA period for trend directionRSIRSI Length14RSI calculation periodRSI Oversold Level30Long entry RSI thresholdRSI Overbought Level70Short entry RSI thresholdDivergence Lookback10Bars to scan for divergenceSwing DetectionSwing Lookback5Bars left/right to confirm swingRisk ManagementATR Length14ATR calculation periodStop Loss ATR Multiplier2.0SL = 2× ATR from entryTake Profit %2.0TP = entry ± 2%Trade DirectionTrade LongstrueEnable long tradesTrade ShortstrueEnable short trades
Entry Conditions
Long Entry (all must be true):
4H uptrend (price above 50 EMA + EMA rising)
Current price above 4H 50 EMA
Price pulling back from recent 4H swing high
RSI oversold (<30) or below 40
Bullish RSI divergence OR RSI turning up from oversold
Bullish engulfing candle at or within 2 bars after swing low
Short Entry (all must be true):
4H downtrend (price below 50 EMA + EMA falling)
Current price below 4H 50 EMA
Price pulling back from recent 4H swing low
RSI overbought (>70) or above 60
Bearish RSI divergence OR RSI turning down from overbought
Bearish engulfing candle at or within 2 bars after swing high
Exit Conditions
Exit TypeLongShortStop LossEntry - (2 × ATR)Entry + (2 × ATR)Take ProfitEntry × 1.02 (+2%)Entry × 0.98 (-2%)
What It Displays
On Chart:
Blue line = 4H 50 EMA
Green triangle below bar = long entry signal
Red triangle above bar = short entry signal
Green background tint = 4H uptrend active
Red background tint = 4H downtrend active
Info Table (top right):
FieldShows4H TrendUP ↑ / DOWN ↓ / NEUTRALPrice vs EMAABOVE / BELOWPullback LYES/NO (long pullback active)Pullback SYES/NO (short pullback active)Bull DivYES/NO (bullish divergence)Bear DivYES/NO (bearish divergence)
Strategy Logic Flow
4H TREND CHECK
↓
PRICE VS 50 EMA
↓
PULLBACK DETECTED?
↓
RSI CONDITION MET?
↓
RSI DIVERGENCE?
↓
ENGULFING AT SWING?
↓
ENTRY → SL (2×ATR) + TP (2%)
Alerts Available
Long Entry Signal — Triggers when all long conditions align
Short Entry Signal — Triggers when all short conditions align
Recommended Usage
Apply to 15-minute chart (fetches 4H data automatically)
Use alongside the RSI Panel indicator for visual confirmation
Backtest on trending pairs/assets (crypto, forex majors, indices)
Adjust ATR multiplier if stops are too tight/wide for your asset
RACZ-SIGNAL-V2.1RACZ-SIGNAL-V2.1 – Reactive Analytical Confluence Zones
Developed by: RACZ Trading
Indicator Type: Multi-Factor Confluence System
Overlay: Off (separate pane)
Purpose: Detect powerful trade opportunities through confluence of technical signals.
⸻
🔍 What is RACZ?
RACZ stands for Reactive Analytical Confluence Zones.
It’s a high-precision trading tool built for traders who rely on multi-signal confirmation, momentum alignment, and market structure awareness.
Rather than relying on a single technical metric, RACZ dynamically combines RSI, VWAP-RSI, Divergence, ADX, and Volume Analytics to produce a composite signal score from 0 to 12 — the higher the score, the stronger the signal.
⸻
🧠 How It Works – Core Components
1. RSI Analysis
• Detects momentum shifts.
• Compares RSI value to overbought (default: 67) and oversold (default: 33) thresholds.
• Adds points to Bullish or Bearish score.
2. VWAP-RSI
• Uses RSI based on VWAP (Volume Weighted Average Price).
• Adds weight to signals influenced by volume-adjusted price movement.
3. Divergence Detection
• Detects potential reversal zones.
• Bullish Divergence: RSI crosses up from low zone.
• Bearish Divergence: RSI crosses down from high zone.
• Strong confluence signal when present.
4. ADX Dynamic Strength Filter
• Custom-calculated ADX (trend strength indicator).
• Uses a dynamic threshold derived from SMA of ADX over a lookback period, scaled by a factor (default 0.9).
• Ensures signals are only validated in strong trend environments.
5. Volume Z-Score
• Detects anomalies in volume behavior.
• Z-score applied to 20-period volume average & deviation.
• Labels spikes, drops, high/low volume conditions.
⸻
📊 Signal Scoring Logic
Each component (RSI, VWAP-RSI, Divergence, ADX) can score up to 3 points each.
• Bullish Score: Total from bullish alignment of each factor.
• Bearish Score: Total from bearish alignment of each factor.
• Signal Power = max(bullish, bearish)
📈 Signal Interpretation
• BUY: Bullish Score > Bearish Score
• SELL: Bearish Score > Bullish Score
• NEUTRAL: Scores are equal
• Signal power is plotted on a 0–12 histogram:
• 0–5 = Weak
• 6–8 = Medium
• 9–12 = Strong (High Confluence Zone)
🖥️ Live Status Panel (Top-Right Corner)
This real-time panel helps you break down the signal:Component
Value Explanation: RSI / VWAP / DIV / ADX
Shows points contributing to signal
SIGNAL: Current market bias (BUY, SELL, NEUTRAL)
VOLUME: Volume classification (Spike, Drop, High, Low, Normal)
Color-coded for quick interpretation.
✅ How to Use
1. Look at Histogram: Bars ≥6 suggest valid setups, especially ≥9.
2. Confirm Panel Agreement: Check which components are supporting the signal.
3. Validate Volume: Unusual spikes/drops often precede strong moves.
4. Follow Direction: Use BUY/SELL signals aligned with signal power and trend.
⸻
⚙️ Customizable Inputs
• RSI period, overbought/oversold levels
• VWAP-RSI period
• ADX period and dynamic threshold settings
• Fully adjustable to fit any trading style
⸻
🚀 Why Choose RACZ?
• Clarity: Scores & signals derived from multiple tools, not just one.
• Confluence Logic: Designed for traders who look for confirmation across indicators.
• Speed: Real-time responsiveness to changing market dynamics.
• Volume Awareness: Integrated volume intelligence gives a deeper edge.
⸻
⚠️ Disclaimer
This indicator is intended strictly for educational and informational purposes only. It is not financial advice and should not be used to make actual investment decisions. Always conduct your own research or consult with a licensed financial advisor before trading or investing. Use of this script is at your own risk.
Kzx | RSI + Div + MACDComponents Description:
Relative Strength Index (RSI):
Purpose: Measures the magnitude of recent price changes to evaluate overbought or oversold conditions in the price of a stock or other asset.
Implementation: The script allows users to set the length of the RSI calculation and defines overbought and oversold levels, which can be visually represented on the chart. Additional features include options to fill and/or color the background of the chart when overbought or oversold levels are reached.
Divergence (Div):
Purpose: Identifies instances where the price of an asset is moving in the opposite direction of a momentum indicator, such as the RSI in this script. Divergences can signal potential trend reversals.
Implementation: The script provides options for users to define the conditions under which divergences are identified, including the source of price tops/bottoms, detection limits, and the maximum lookback period for divergence analysis. It visually highlights these divergences on the chart.
Moving Average Convergence Divergence (MACD):
Purpose: Tracks the relationship between two moving averages of a security's price. The MACD is used to identify trend direction, momentum, and potential reversal points through crossovers.
Implementation: The script calculates the MACD line and its signal line. It plots buy or sell markers based on crossovers between these two lines, indicating potential entry or exit points.
Script Category:
Category: Technical Analysis / Indicators and Strategies
Subcategory: Oscillators (for RSI and MACD) and Trend Analysis (for Divergence)
Usage:
The script is designed for traders and analysts who rely on technical analysis to make informed decisions in the financial markets. By integrating RSI, divergence detection, and MACD analysis into a single script, users can gain a more nuanced understanding of market conditions, potentially improving their trading strategies.
Customization and Visualization:
Users can customize various parameters, including lengths for RSI and MACD, overbought/oversold levels, divergence detection criteria, and visual aspects like colors and marker sizes.
The script provides visual cues directly on the price chart, making it easy to spot potential buy/sell signals, overbought/oversold conditions, and divergences without the need to switch between different indicators.
Divergence Macd+RSI Fast[RSU] -- No RepaintThis indicator combines the divergence of rsi and macd and displays it on the candlestick chart.
RSI:
1. When rsi is at a high point, once it falls by 1 k line, it will detect the divergence from the previous high point. This can quickly find the divergence that has taken effect and help you quickly capture the trend before a sharp decline or rise.
The difference between other RSI divergence indicators: the official divergence indicator is to detect the 5 and the k line, which may lead to a large amount of decline.
2. This indicator detects the previous high and the previous low of 5, 10, 20 lengths at the same time, instead of only detecting a fixed length, so that more deviations can be found.
MACD:
1. When MACD-diff line(orange color) is at a high point, once it falls by 1 k line, it will detect the divergence from the previous high point. This can quickly find the divergence that has taken effect and help you quickly capture the trend before a sharp decline or rise.
2. This indicator detects the previous high and the previous low of 5, 10, 20, 40 , 60 lengths at the same time, instead of only detecting a fixed length, so that more divergences can be found.
Notice:
Because it is a quick divergence detection, it is recommended to confirm that the divergence takes effect after the current k is completely closed first. I have identified this state in the indicator as "k not end".
Disadvantages and Risks:
Since it is a quick discovery, there will be error identification. Error divergences will recolor to grey.
Suggestion:
Use Alert catching divergence occurrences.
Please do not:
Don't go short in the uptrend, don't go long in the downtrend.
Top divergences that occur because of a strong uptrend are usually only temporary pullbacks. Bottom divergences in persistent declines are also temporary rallies. Do not attempt to trade such low-return trades.
It is recommended to use the divergence indicator when the stock price has made a new high and retraced, and once again made a new high, because this often leads to the end of the trend.
Divergence how to use:
1. After the previous candlestick was completely closed, a bottom divergence was found.
2. Open an long order at the beginning of the second bar, or as close to the bottom as possible (because the stop loss will be smaller).
3. Break the stop loss price below the previous low where the divergence occurred, which already means that the divergence is wrong.
RSI in pane and 3 EMAs on chartCustom RSI in Pane + 3 EMAs on Chart — with Optional RSI Divergence Detection
Combines RSI in a separate pane with 3 EMAs on the chart and optional RSI-based divergence detection. Useful for analyzing both momentum and trend structure.
Features
RSI Pane
Custom RSI calculation (not built-in ta.rsi) with adjustable source and length
Overlay optional moving average (SMA, EMA, SMMA/RMA, WMA, VWMA, or Bollinger Bands) Overbought/oversold gradient fill for visual clarity (70 / 30 zones)
Midline (50) for neutral RSI territory
RSI Divergence Detection
Optional: toggle on/off with one input
Regular Bullish Divergence : Price makes a lower low, RSI makes a higher low
Regular Bearish Divergence : Price makes a higher high, RSI makes a lower high
Customizable lookback for pivot detection
Visual markers and labels plotted on RSI
Built-in alert conditions for both divergence types
3 EMA Trend Indicators on Price Chart
Three customizable EMAs (default: 20, 50, 200)
Color-coded and clearly plotted on main chart
Use to determine short/mid/long-term trend bias
No repainting or smoothing artifacts
Why use this script?
Gives a full view of trend + momentum without cluttering the main price chart, and it helps confirm entries and exits by observing RSI behavior alongside EMAs. The optional divergence detection can act as a signal for potential exhaustion or reversal (not entry signals on their own). It is a Good fit for traders who use RSI zones, divergences, and EMA structure in their decision-making, both for intra-day and swing trades (where it performs best).
How to use
Add this script to your chart. EMAs will appear on the main price chart; RSI and divergence will appear in a separate pane.
Adjust RSI and MA settings to fit your trading style (e.g., fast RSI for scalping, slower for swing)
Enable "Show Divergence" if you want visual alerts and markers
Use alerts to get notified when a divergence occurs without watching the chart
Always check the divergences on different time frames to validate the setup, and do not consider them valid on small time frames (<15 minutes).
Built for traders who want both momentum and trend context in a single tool — without clutter, repainting, or noise. I created this script to streamline my own analysis and avoid switching between multiple indicators. It's not meant to be a "signal generator" but a visual assistant for making better decisions. If you find it useful or have feedback, feel free to reach out.
RSI Overbought/Oversold + Divergence IndicatorDESCRIPTION:
This script combines the Relative Strength Index ( RSI ), Moving Average and Divergence indicator to make a better decision when to enter or exit a trade.
- The Moving Average line (MA) has been made hidden by default but enhanced with an RSIMA cloud.
- When the RSI is above the selected MA it turns into green and when the RSI is below the select MA it turns into red.
- When the RSI is moving into the Overbought or Oversold area, some highlighted areas will appear.
- When some divergences or hidden divergences are detected an extra indication will be highlighted.
- When the divergence appear in the Overbought or Oversold area the more weight it give to make a decision.
- The same color pallet has been used as the default candlestick colors so it looks familiar.
HOW TO USE:
The prerequisite is that we have some knowledge about the Elliot Wave Theory, the Fibonacci Retracement and the Fibonacci Extension tools.
Wave 1
(1) When we receive some buy signals we wait until we receive some extra indications.
(2) On the RSI Overbought/Oversold + Divergence Indicator we can see a Bullish Divergence and our RSI is changing from red to green ( RSI is higher then the MA).
(3) If we are getting here into the trade then we need to use a stop loss. We put our stop loss 1 a 2 pips just below the lowest wick. We also invest maximum 50% of the total amount we want to invest.
Wave 2
(4) Now we wait until we see a clear reversal and here we starting to use the Fibonacci Retracement tool. We draw a line from the lowest point of wave(1) till the highest point of wave (1). When we are retraced till the 0.618 fib also called the golden ratio we check again the RSI Overbought/Oversold + Divergence Indicator. When we see a reversal we do our second buy. We set again a stop loss just below the lowest wick (this is the yellow line on the chart). We also move the stop loss we have set in step (3) to this level.
Wave 3
(5) To identify how far the uptrend can go we need to use the Fibonacci Extension tool. We draw a line from the lowest point of wave(1) till the highest point of wave (1) and draw it back to the lowest point of wave (2). Wave (3) is most of the time the longest wave and can go till it has reached the 1.618 or 2.618 fib. On the 1.618 we can take some profit. If we don't want to sell we move our stop loss to the 1 fib line (yellow line on the chart).
(6) We wait until we see a clear reversal on the Overbought/Oversold + Divergence Indicator and sell 33% to 50% of our investment.
Wave 4
(7) Now we wait again until we see a clear reversal and here we starting to use the Fibonacci Retracement tool. We draw a line from the lowest point of wave(2) till the highest point of wave (3). When we are retraced till the 0.618 fib also called the golden ratio we check again the RSI Overbought/Oversold + Divergence Indicator. When we see a reversal we buy again. We set again a stop loss just below the lowest wick (this is the yellow line on the chart).
(8) If we bought at the first reversal ours stop los was triggered (9) and we got out of the trade.
(9) If we did not bought at step (7) because our candle did not hit the 0.618 fib or we got stopped out of the trade we buy again at the reversal.
Wave 5
(10) To identify how far the uptrend can go we need to use the Fibonacci Extension tool. We draw a line from the lowest point of wave(2) till the highest point of wave (3) and draw it back to the lowest point of wave (4). Most of the time wave 5 goes up till it has reached the 1 fib. And that is the point where we got out of the trade with all of our investment. In this trade we got out of the trade a bit earlier. We received the sell signals and got a reversal on the Overbought/Oversold + Divergence Indicator.
We are hoping you learned something so you can make better decisions when to get into or out of a trade.
If you have any question just drop it into the comments below.
FEATURES:
• You can show/hide the RSI .
• You can show/hide the MA.
• You can show/hide the lRSIMA cloud.
• You can show/hide the Stoch RSI cloud.
• You can show/hide and adjust the Overbought and Oversold zones.
• You can show/hide and adjust the Overbought Extended and Oversold Extended zones.
• You can show/hide the Overbought and Oversold highlighted zones.
• Etc...
HOW TO GET ACCESS TO THE SCRIPT:
• Favorite the script and add it to your chart.
REMARKS:
• This advice is NOT financial advice.
• We do not provide personal investment advice and we are not a qualified licensed investment advisor.
• All information found here, including any ideas, opinions, views, predictions, forecasts, commentaries, suggestions, or stock picks, expressed or implied herein, are for informational, entertainment or educational purposes only and should not be construed as personal investment advice.
• We will not and cannot be held liable for any actions you take as a result of anything you read here.
• We only provide this information to help you make a better decision.
• While the information provided is believed to be accurate, it may include errors or inaccuracies.
Good Luck and have fun,
The CryptoSignalScanner Team
Musashi_Fractal_Dimension === Musashi-Fractal-Dimension ===
This tool is part of my research on the fractal nature of the markets and understanding the relation between fractal dimension and chaos theory.
To take full advantage of this indicator, you need to incorporate some principles and concepts:
- Traditional Technical Analysis is linear and Euclidean, which makes very difficult its modeling.
- Linear techniques cannot quantify non-linear behavior
- Is it possible to measure accurately a wave or the surface of a mountain with a simple ruler?
- Fractals quantify what Euclidean Geometry can’t, they measure chaos, as they identify order in apparent randomness.
- Remember: Chaos is order disguised as randomness.
- Chaos is the study of unstable aperiodic behavior in deterministic non-linear dynamic systems
- Order and randomness can coexist, allowing predictability.
- There is a reason why Fractal Dimension was invented, we had no way of measuring fractal-based structures.
- Benoit Mandelbrot used to explain it by asking: How do we measure the coast of Great Britain?
- An easy way of getting the need of a dimension in between is looking at the Koch snowflake.
- Market prices tend to seek natural levels of ranges of balance. These levels can be described as attractors and are determinant.
Fractal Dimension Index ('FDI')
Determines the persistence or anti-persistence of a market.
- A persistent market follows a market trend. An anti-persistent market results in substantial volatility around the trend (with a low r2), and is more vulnerable to price reversals
- An easy way to see this is to think that fractal dimension measures what is in between mainstream dimensions. These are:
- One dimension: a line
- Two dimensions: a square
- Three dimensions: a cube.
--> This will hint you that at certain moment, if the market has a Fractal Dimension of 1.25 (which is low), the market is behaving more “line-like”, while if the market has a high Fractal Dimension, it could be interpreted as “square-like”.
- 'FDI' is trend agnostic, which means that doesn't consider trend. This makes it super useful as gives you clean information about the market without trying to include trend stuff.
Question: If we have a game where you must choose between two options.
1. a horizontal line
2. a vertical line.
Each iteration a Horizontal Line or a Square will appear as continuation of a figure. If it that iteration shows a square and you bet vertical you win, same as if it is horizontal and it is a line.
- Wouldn’t be useful to know that Fractal dimension is 1.8? This will hint square. In the markets you can use 'FD' to filter mean-reversal signals like Bollinger bands, stochastics, Regular RSI divergences, etc.
- Wouldn’t be useful to know that Fractal dimension is 1.2? This will hint Line. In the markets you can use 'FD' to confirm trend following strategies like Moving averages, MACD, Hidden RSI divergences.
Calculation method:
Fractal dimension is obtained from the ‘hurst exponent’.
'FDI' = 2 - 'Hurst Exponent'
Musashi version of the Classic 'OG' Fractal Dimension Index ('FDI')
- By default, you get 3 fast 'FDI's (11,12,13) + 1 Slow 'FDI' (21), their interaction gives useful information.
- Fast 'FDI' cross will give you gray or red dots while Slow 'FDI' cross with the slowest of the fast 'FDI's will give white and orange dots. This are great to early spot trend beginnings or trend ends.
- A baseline (purple) is also provided, this is calculated using a 21 period Bollinger bands with 1.618 'SD', once calculated, you just take midpoint, this is the 'TDI's (Traders Dynamic Index) way. The indicator will print purple dots when Slow 'FDI' and baseline crosses, I see them as Short-Term cycle changes.
- Negative slope 'FDI' means trending asset.
- Positive most of the times hints correction, but if it got overextended it might hint a rocket-shot.
TDI Ranges:
- 'FDI' between 1.0≤ 'FDI' ≤1.4 will confirm trend following continuation signals.
- 'FDI' between 1.6≥ 'FDI' ≥2.0 will confirm reversal signals.
- 'FDI' == 1.5 hints a random unpredictable market.
Fractal Attractors
- As you must know, fractals tend orbit certain spots, this are named Attractors, this happens with any fractal behavior. The market of course also shows them, in form of Support & Resistance, Supply Demand, etc. It’s obvious they are there, but now we understand that they’re not linear, as the market is fractal, so simple trendline might not be the best tool to model this.
- I’ve noticed that when the Musashi version of the 'FDI' indicator start making a cluster of multicolor dots, this end up being an attractor, I tend to draw a rectangle as that area as price tend to come back (I still researching here).
Extra useful stuff
- Momentum / speed: Included by checking RSI Study in the indicator properties. This will add two RSI’s (9 and a 7 periods) plus a baseline calculated same way as explained for 'FDI'. This gives accurate short-term trends. It also includes RSI divergences (regular and hidden), deactivate with a simple check in the RSI section of the properties.
- BBWP (Bollinger Bands with Percentile): Efficient way of visualizing volatility as the percentile of Bollinger bands expansion. This line varies color from Iced blue when low volatility and magma red when high. By default, comes with the High vols deactivated for better view of 'FDI' and RSI while all studies are included. DDWP is trend agnostic, just like 'FDI', which make it very clean at providing information.
- Ultra Slow 'FDI': I noticed that while using BBWP and RSI, the indicator gets overcrowded, so there is the possibility of adding only one 'FDI' + its baseline.
Final Note: I’ve shown you few ways of using this indicator, please backtest before using in real trading. As you know trading is more about risk and trade management than the strategy used. This still a work in progress, I really hope you find value out of it. I use it combination with a tool named “Musashi_Katana” (also found in TradingView).
Best!
Musashi
MACD Divergence Fast by RSUAdvantages:
1. When MACD-diff line(orange color) is at a high point, once it falls by 1 k line, it will detect the divergence from the previous high point. This can quickly find the divergence that has taken effect and help you quickly capture the trend before a sharp decline or rise.
2. This indicator detects the previous high and the previous low of 5, 10, 20, 40, 60 lengths at the same time, instead of only detecting a fixed length, so that more divergences can be found.
Notice:
Because it is a quick divergence detection, it is recommended to confirm that the divergence takes effect after the current k is completely closed first. I have identified this state in the indicator as "k not end".
Disadvantages and Risks:
Since it is a quick discovery, there will be error identification. Error divergences will recolor to grey.
Suggestion:
Use “RSI Divergence Fast by RSU” at the same time, because RSI divergence usually occurs before macd, if the position diverges at the same time, the probability of success will increase.
Please do not:
Don't go short in the uptrend, don't go long in the downtrend.
Top divergences that occur because of a strong uptrend are usually only temporary pullbacks. Bottom divergences in persistent declines are also temporary rallies. Do not attempt to trade such low-return trades.
It is recommended to use the divergence indicator when the stock price has made a new high and retraced, and once again made a new high, because this often leads to the end of the trend.
Divergence how to use:
1. After the previous K line was completely closed, a bottom divergence was found.
2. Open an long order at the beginning of the second bar, or as close to the bottom as possible (because the stop loss will be smaller).
3. Break the stop loss price below the previous low where the divergence occurred, which already means that the divergence is wrong.
Filtered RSI Divergence Finder Check the settings to see how the filters work. I added alerts and a feature that shows the divergences that have been filtered, but as faded "ghost" divergences. Spooooky. This is useful for tuning the script to a particular market. All credit to RicardoSantos for the original.
Apex Edge – Super RSIThe Apex Edge – Super RSI is not your average RSI. This is an institutional-grade signal engine designed for serious traders who want confluence, control, and confidence — all wrapped into one visual powerhouse.
━━━━━━━━━━━━━━━━━━━━
KEY FEATURES
━━━━━━━━━━━━━━━━━━━━
✔ **RSI + Divergence Engine**
• Classic & Hidden Divergences (auto-detected)
• Labelled with shapes:
▲ Green Triangle – Buy Signal (strength-based size)
▼ Red Triangle – Sell Signal
◆ Green Diamond – Classic Bullish Divergence
◆ Red Diamond – Classic Bearish Divergence
● Green Circle – Hidden Bullish Divergence
● Red Circle – Hidden Bearish Divergence
Note - Users can edit symbol colours in settings for better clarity
✔ **Trap Detection System**
• Detects low-move, high-signal clusters (liquidity traps)
• Automatically suppresses signals for X bars after detection
• Trap zones shown with shaded background (optional)
✔ **Signal Scoring Logic**
• Each signal is scored 1–6 based on:
• RSI Threshold Break
• RSI Slope
• Divergence Detected
• Trap Avoidance
• Multi-Timeframe Confluence (optional)
• The plotted shape size reflects the strength of the entry signal
✔ **Multi-Timeframe Confluence (MTF)**
• Optional filter that uses HTF and VHTF RSI alignment
• Prevents countertrend signals
• MTF Bias shown on HUD panel
✔ **Always-On HUD Panel**
• Displays:
• Signal Type
• Signal Score
• Divergence Type
• RSI (LTF & HTF)
• Trap & Cooldown Status
• MTF Bias
• Volatility %
✔ **Alert Ready**
• Buy/Sell alerts
• Trap Detected alert
• Divergence alert with dynamic message
• Perfect for webhook integrations
━━━━━━━━━━━━━━━━━━━━
📘 HOW TO TRADE IT
━━━━━━━━━━━━━━━━━━━━
✅ **Buy Setup**
• Green triangle (▲) appears **below bar**
• RSI is oversold and rising
• HTF RSI agrees (optional)
• Signal score is 3+ for best confidence
• Avoid signals during cooldown zone
✅ **Sell Setup**
• Red triangle (▼) appears **above bar**
• RSI is overbought and falling
• HTF RSI agrees (optional)
• Signal score is 3+ for best confidence
✅ **Divergences**
• Use diamonds/circles to identify momentum shifts
• Strongest when aligned with score 4–6
❗**Trap Zones**
• When background is shaded, wait for cooldown
• Signals during traps are suppressed for safety
━━━━━━━━━━━━━━━━━━━━
📊 BEST USED WITH
━━━━━━━━━━━━━━━━━━━━
🔹 Apex Edge – Session Sweep Pro (to visualize liquidity levels)
🔹 Volume Profile or OBV (volume-based confirmation)
🔹 EMA Ribbon (for trend alignment)
🔹 Fair Value Gap indicator (smart money models)
━━━━━━━━━━━━━━━━━━━━
🧠 PRO TIPS
━━━━━━━━━━━━━━━━━━━━
• Use the HUD for decision confidence — if everything aligns, you’ve got an Apex-grade setup.
• Wait for candle close to confirm divergence-based entries.
• Score 5–6 = sniper entries. Score 1–2 = warning shots.
This indicator can be used alongside Apex Edge Session Sweep Pro for better visual clarity.
━━━━━━━━━━━━━━━━━━━━
© Apex Edge | All rights reserved.
3 days ago
Release Notes
Update - Added a toggle to show/hide HUD when using on smaller mobile devices so as not to clutter the screen.
MACD, ADX & RSI -> for altcoins# MACD + ADX + RSI Combined Indicator
## Overview
This advanced technical analysis tool combines three powerful indicators (MACD, ADX, and RSI) into a single view, providing a comprehensive analysis of trend, momentum, and divergence signals. The indicator is designed to help traders identify potential trading opportunities by analyzing multiple aspects of price action simultaneously.
## Components
### 1. MACD (Moving Average Convergence Divergence)
- **Purpose**: Identifies trend direction and momentum
- **Components**:
- Fast EMA (default: 12 periods)
- Slow EMA (default: 26 periods)
- Signal Line (default: 9 periods)
- Histogram showing the difference between MACD and Signal line
- **Visual**:
- Blue line: MACD line
- Orange line: Signal line
- Green/Red histogram: MACD histogram
- **Interpretation**:
- Histogram color changes indicate potential trend shifts
- Crossovers between MACD and Signal lines suggest entry/exit points
### 2. ADX (Average Directional Index)
- **Purpose**: Measures trend strength and direction
- **Components**:
- ADX line (default threshold: 20)
- DI+ (Positive Directional Indicator)
- DI- (Negative Directional Indicator)
- **Visual**:
- Navy blue line: ADX
- Green line: DI+
- Red line: DI-
- **Interpretation**:
- ADX > 20 indicates a strong trend
- DI+ crossing above DI- suggests bullish momentum
- DI- crossing above DI+ suggests bearish momentum
### 3. RSI (Relative Strength Index)
- **Purpose**: Identifies overbought/oversold conditions and divergences
- **Components**:
- RSI line (default: 14 periods)
- Divergence detection
- **Visual**:
- Purple line: RSI
- Horizontal lines at 70 (overbought) and 30 (oversold)
- Divergence labels ("Bull" and "Bear")
- **Interpretation**:
- RSI > 70: Potentially overbought
- RSI < 30: Potentially oversold
- Bullish/Bearish divergences indicate potential trend reversals
## Alert System
The indicator includes several automated alerts:
1. **MACD Alerts**:
- Rising to falling histogram transitions
- Falling to rising histogram transitions
2. **RSI Divergence Alerts**:
- Bullish divergence formations
- Bearish divergence formations
3. **ADX Trend Alerts**:
- Strong trend development (ADX crossing threshold)
- DI+ crossing above DI- (bullish)
- DI- crossing above DI+ (bearish)
## Settings Customization
All components can be fine-tuned through the settings panel:
### MACD Settings
- Fast Length
- Slow Length
- Signal Smoothing
- Source
- MA Type options (SMA/EMA)
### ADX Settings
- Length
- Threshold level
### RSI Settings
- RSI Length
- Source
- Divergence calculation toggle
## Usage Guidelines
### Entry Signals
Strong entry signals typically occur when multiple components align:
1. MACD histogram color change
2. ADX showing strong trend (>20)
3. RSI showing divergence or leaving oversold/overbought zones
### Exit Signals
Consider exits when:
1. MACD crosses signal line in opposite direction
2. ADX shows weakening trend
3. RSI reaches extreme levels with divergence
### Risk Management
- Use the indicator as part of a complete trading strategy
- Combine with price action and support/resistance levels
- Consider multiple timeframe analysis for confirmation
- Don't rely solely on any single component
## Technical Notes
- Built for TradingView using Pine Script v5
- Compatible with all timeframes
- Optimized for real-time calculation
- Includes proper error handling and NA value management
- Memory-efficient calculations for smooth performance
## Installation
1. Copy the provided Pine Script code
2. Open TradingView Chart
3. Create New Indicator -> Pine Editor
4. Paste the code and click "Add to Chart"
5. Adjust settings as needed through the indicator settings panel
## Version Information
- Version: 2.0
- Last Updated: November 2024
- Platform: TradingView
- Language: Pine Script v5
peacefulIndicatorsWe are delighted to present the PeacefulIndicators library, a modest yet powerful collection of custom technical indicators created to enhance your trading analysis. The library features an array of practical tools, including MACD with Dynamic Length, Stochastic RSI with ATR Stop Loss, Bollinger Bands with RSI Divergence, and more.
The PeacefulIndicators library offers the following functions:
macdDynamicLength: An adaptive version of the classic MACD indicator, which adjusts the lengths of the moving averages based on the dominant cycle period, providing a more responsive signal.
rsiDivergence: A unique implementation of RSI Divergence detection that identifies potential bullish and bearish divergences using a combination of RSI and linear regression.
trendReversalDetection: A helpful tool for detecting trend reversals using the Rate of Change (ROC) and Moving Averages, offering valuable insights into possible market shifts.
volume_flow_oscillator: A custom oscillator that combines price movement strength and volume to provide a unique perspective on market dynamics.
weighted_volatility_oscillator: Another custom oscillator that factors in price volatility and volume to deliver a comprehensive view of market fluctuations.
rvo: The Relative Volume Oscillator highlights changes in volume relative to historical averages, helping to identify potential breakouts or reversals.
acb: The Adaptive Channel Breakout indicator combines a moving average with an adjustable volatility multiplier to create dynamic channels, useful for identifying potential trend shifts.
We hope this library proves to be a valuable addition to your trading toolbox.
Library "peacefulIndicators"
A custom library of technical indicators for trading analysis, including MACD with Dynamic Length, Stochastic RSI with ATR Stop Loss, Bollinger Bands with RSI Divergence, and more.
macdDynamicLength(src, shortLen, longLen, signalLen, dynLow, dynHigh)
Moving Average Convergence Divergence with Dynamic Length
Parameters:
src (float) : Series to use
shortLen (int) : Shorter moving average length
longLen (int) : Longer moving average length
signalLen (int) : Signal line length
dynLow (int) : Lower bound for the dynamic length
dynHigh (int) : Upper bound for the dynamic length
Returns: tuple of MACD line and Signal line
Computes MACD using lengths adapted based on the dominant cycle period
rsiDivergence(src, rsiLen, divThreshold, linRegLength)
RSI Divergence Detection
Parameters:
src (float) : Series to use
rsiLen (simple int) : Length for RSI calculation
divThreshold (float) : Divergence threshold for RSI
linRegLength (int) : Length for linear regression calculation
Returns: tuple of RSI Divergence (positive, negative)
Computes RSI Divergence detection that identifies bullish (positive) and bearish (negative) divergences
trendReversalDetection(src, rocLength, maLength, maType)
Trend Reversal Detection (TRD)
Parameters:
src (float) : Series to use
rocLength (int) : Length for Rate of Change calculation
maLength (int) : Length for Moving Average calculation
maType (string) : Type of Moving Average to use (default: "sma")
Returns: A tuple containing trend reversal direction and the reversal point
Detects trend reversals using the Rate of Change (ROC) and Moving Averages.
volume_flow_oscillator(src, length)
Volume Flow Oscillator
Parameters:
src (float) : Series to use
length (int) : Period for the calculation
Returns: Custom Oscillator value
Computes the custom oscillator based on price movement strength and volume
weighted_volatility_oscillator(src, length)
Weighted Volatility Oscillator
Parameters:
src (float) : Series to use
length (int) : Period for the calculation
Returns: Custom Oscillator value
Computes the custom oscillator based on price volatility and volume
rvo(length)
Relative Volume Oscillator
Parameters:
length (int) : Period for the calculation
Returns: Custom Oscillator value
Computes the custom oscillator based on relative volume
acb(price_series, ma_length, vol_length, multiplier)
Adaptive Channel Breakout
Parameters:
price_series (float) : Price series to use
ma_length (int) : Period for the moving average calculation
vol_length (int) : Period for the volatility calculation
multiplier (float) : Multiplier for the volatility
Returns: Tuple containing the ACB upper and lower values and the trend direction (1 for uptrend, -1 for downtrend)


